Thursday, March 24, 2011

Recent presentations on the events at Fukushima

Each of these presentations was designed to engage and inform the general public about the events which have occurred at Fukushima, including a specific explanation of what we understand to have happened so far from the perspective of experts and ultimately what is being done now to bring the situation under control. The advantage of these types of seminars is that the offer the ability to convey more detailed explanations of the specific sequences of events that lead to the current situation which are typically not available in traditional media accounts.

Wednesday, March 23, 2011

Update on Dose Readings in Japan

This is a quick post to summarize the newest and best things on the new I have my hands on to assess the state of the dispersion of radioactive gases from Fukushima I.

Best Sources of Understandable Information

Firstly, a great new blog called Where are the Clouds? They are doing a fantastic job of following the new developments and actively contributing to the body of knowledge regarding dose rate readings and atmospheric plume modeling in the wake of the disaster. These are the professionals.

A fantastic new graphic has appeared showing the plant site dose readings from the start through the "hottest" (radiological) days at the site. You can probably read this graph for half an hour. Credit to R.C. Hoetzlein, and many thanks for releasing it for all uses. There are still a few issues related to the units and comparisons, but otherwise amazing.


Tepco reorganizes monitor readings

I imagine it's hard for reporting offices to navigate the incredibly disjointed press releases coming from Tepco. A few days ago, they were in the main list of press releases on their home page. But then they moved it to a new page of releases of nothing but monitor readings specific to the plant. I had been coming back to the NYTimes graph for what the site readings are now giving, but it seems they stopped right about the time Tepco moved the page.

Maybe they never got the memo. Or maybe they became bored of it. The most recent graph I see now is still a few days old, but as I've looked at the reports, not much has changed. On top of that, Tepco has released local area data that the NYTimes has graphed fairly well (this covers a lot of Fukushima Prefecture). Additionally, Tepco has updated this information over time, which gives a little bit more interesting picture than the confusing site readings.

Of course, there is still bad information out there. The NYTimes published a map supposedly showing the dose rates at different radii from the plant, which would seem to any ordinary reader to predict nausea, vomiting, and hair loss at 5 miles away from the plant. The only problem is that it was made with no information specific to Fukushima I, aside from an assumption that fuel was failed, core melt occurred, containment was breached, etc. It's hard to identify just how wrong this graph is, because it doesn't even give enough information to know (i mean, exposure time). Thankfully, other bloggers have been identifying this as a misuse of a model from an old and otherwise well-intentioned paper. And anyway, to get an idea of what doses people in Japan are facing, you can just keep reading.

What is Happening to Dose Rates in Japan?

Note, in order to convert to Japan time right now, switch am and pm, then add 1 hour. To convert back to EST, switch am/pm and subtract an hour.

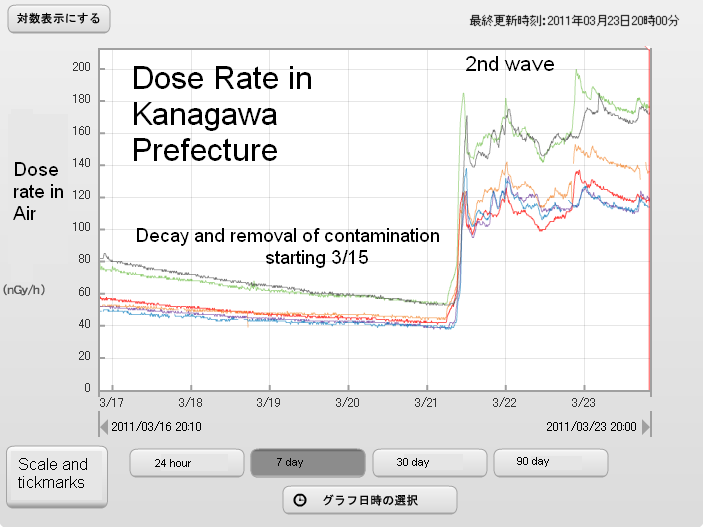
There have been 2 major onsets of radiation spread over areas to the southwest of the Fukushima Daiichi plant. The first was very early on Tuesday 3/15 (Japan time). I've gone back and plotted the dose rates in Ibaraki Prefecture monitoring stations to compliment the previous graph I posted.


Note that this is in log scale now. Ibaraki Prefecture is much closer to Fukushima than Tokyo and correspondingly has much higher dose rates, and yes, will have greater long term effects as well. Fukushima Prefecture, of course, is hit harder than any other. Let's return to Tokyo. How have things changed there? A second wave of artificial radiation has clearly appeared. The following shows the dose rates as the first and second major Southwest winds pushed the plume over the Tokyo area.


One can easily identify the two transit dates the plume made through Tokyo. One is 3/15 in the morning and another is 3/21 in the morning. For 3/15, atmospheric data shows a line going straight through the Tokyo area, which is expected. If that wasn't enough evidence for you, the wind patterns at all altitudes on 3/21 and 3/22 show the plume traveling toward Tokyo and even further.

Mindblowing Analysis from the NNSA

Last post I was praising the public data feed from Japan's national network of detectors. The US, of course, has some impressive technology itself, and the DOE has come out with this bombshell (download in pptx format). The tool is called the Aerial Monitoring System, and obviously they send a plane around that constantly takes readings and quickly flies back and fourth over an area to get an incredible map of dose readings.


These images are showing a local perspective (left) and larger perspective (right). You can see the path the craft takes in the lines that are shown. They show units of mR/hr. For many kinds of radiation, 1 R= 1 rad = 1 rem. 1 rem = 0.01 Sv, and the limit for radiation workers in the US is mSv, or 5 rem (equivalent dose). The red color in the graphs indicates 12.5 mR/hr, and if this was absorbed for a day, that would be 0.3 R, and the equivalent dose (adding extra weighting for more damaging particles) would be some amount more than that.

Without getting into specifics, a 12.5 mR/hr area should really be avoided to whatever extent possible, but there should be differences between the readings from the air and the dose on the ground. Either way, the most important thing to avoid is internal dose. There is no reason to panic. The Japanese authorities have been making decisions to tell people not to eat certain farm products among other measures, these are all reasonable as far as I can tell but firmly based on the precautionary principle.

Monday, March 21, 2011

Symposium on Fukushima Daiichi

Several professors from NC State's nuclear engineering department will be discussing the events at Fukushima Daiichi at a public forum this Wednesday; the event will also be live streamed. See below for details.

NC State nuclear engineering experts to discuss events at Japanese power plant

WhatNuclear engineering experts at North Carolina State University will offer insight and analysis during a symposium on the recent events at the Fukushima Daiichi nuclear power plant in Japan. The plant was damaged during the March 11 earthquake and subsequent tsunami resulting in nuclear fuel damage and the release of radioactive material. Media coverage is invited.

Who: A panel of four NC State nuclear engineering faculty members who have been closely following the events in Japan — Drs. John GilliganMichael DosterPaul Turinsky and Man-Sung Yim — will discuss technical issues related to the damage to the plant, as well as challenges officials face as they try to contain the radioactive material. Audience members will have the opportunity to ask questions during the event.


When: 5 p.m. on Wednesday, March 23.

Live stream also available for public viewing of the symposium (no login required).


Where
Park Shops, Room 130, at 101 Current Drive on NC State’s North Campus (map). Parking is available in the Cates Avenue (Coliseum) Parking Deck at 201 Jeter Drive on Central Campus (map). From the deck, visitors should walk north through the tunnel under the railroad tracks to reach North Campus and Park Shops.

Cost: The event is free and open to the public.

Media ContactNate DeGraff, Engineering Communications, 919.515.3848

Sunday, March 20, 2011

Situation stabilizing at Fukushima

Current reports from TEPCO and NISA indicate that workers have restored off-site power at Units 1 and 2, with plans to restore off-site power to Units 3 and 4 tomorrow (March 21). This is a welcome development, indicating that the situation at the reactors is likely stabilizing. With the restoration of off-site power, cooling pumps can begin to circulate coolant in the reactors and spent fuel cooling pools once more, largely eliminating any further risk of fuel overheating and subsequent inadvertent release of radioactive materials. In addition, holes have been bored into the roofs of Units 5 and 6 as a preventative measure to vent any potential hydrogen buildup as to prevent further explosions of the kind that damaged Units 1 and 3. As off-site power is restored and the radiological levels decline, the damage can be more fully assessed and cleanup work can begin.

Meanwhile, news reports from Japan indicate that through the use of infrared sensors, the surface temperatures at each of the reactors have been verified to be well below 100 C (i.e., the boiling point of water), meaning that water is present at each of the reactor units. It would thus appear that the efforts of workers to restore water to the spent fuel pools and reactors has been successful.

XKCD recently posted a very interesting diagram putting the radiation levels observed in perspective - it's a very useful diagram for directly comparing some of the levels being discussed with levels encountered in everyday settings. This presentation by UCSB physics professor Benjamin Monreal also gives an excellent and concise summary of the likely radiological release consequences of Fukushima as well as past historical incidents (such as Three Mile Island and Chernobyl).

Reports of produce contamination

Now that the situation with the reactors has appeared to have calmed down, much of the media focus now has shifted to reports of radioactive contamination of milk and spinach from areas near the plants. It should be emphasized that the levels of radioactivity found, while above regulatory limits, do not pose any immediate threat to human health.

I will be posting a longer discussion of how radiological contaminaiton gets into the environement (and what we mean by "radiological contamination"), but in the meantime, it is useful to summarize what is going on in this case and the chief areas of concern.

Given the nature of the radioactive release, most the released products fall into the categories of a) Radioactive noble gases (such as krypton, xenon, etc.) and b) Radioactive, chemically active gases such as iodine-131, c) Radioactive isotopes of cesium and strontium.

Noble gases are of little concern, as they do not generally interact with the biosphere (i.e., they don't "stick" to anything, given that they are chemically inert). As a result, these gases will generally travel further into the atmosphere, becoming increasingly diluted (and thus of little concern for human health).

Chemically active species such as iodine are one of the more serious concerns for contamination, as iodine is readily absorbed by the human body (and rapidly taken into the thyroid); this is the basis for using potassium-iodine tablets as a "prophylactic" measure, flooding the thyroid with natural (non-radioactive) iodine such to prevent the uptake of the radioactive species. Iodine in fission products generally falls into two species - iodine-131, which has a half-life of 8 days, and iodine-129, which has a half-life of 15.7 million years. Only iodine-131 is of any serious contamination concern, given the extremely long half-life of iodine-129 (which means the activity from this species is extremely low). (Iodine-129, while being inconsequential to short-term dose, is an isotope of concern for geologic repositories, given its long lifetime and iodine's ease of movement in groundwater.)

Radiological half-life denotes the time in which half of a radioisotope species decays away into a different species. After one half-life, half of the original radioactive species remains; after two half-lives, only a fourth remain, and so on. In some cases, the "daughter" isotope is stable, meaning that no further decays occur. Other times (like with radon), the daughter products are also unstable, leading to a series of decays. (These isotopes can thus be of greater concern - like with radon.)

Iodine-131 decays into Xenon-131, which is stable. Thus, after 8 days, the radiological contamination due to iodine will decrease by approximately half. By three weeks' time, this level will have dropped to an eighth of the original level; by three months' time, the radioactivity from iodine will have virtually disappeared.

Other radioisotopes of concern are strontium-90 and cesium-137, which have half-lives of about 29 and 30 years, respectively. (These two isotopes are incidentally of concern from a waste management perspective, as the heat generated by this pair is a working constraint on repository capacity over the first hundred years.) Because the half-lives of these species are longer, their contributions to dose tends to be extremely small (much of what is ingested would be released by the body before it would decay). Strontium, being of the same element family as calcium, tends to chemically act like calcium in that it is accumulated in the bones; however, the dose levels from strontium would be quite small (far lower than that from natural sources).


Many have pointed to the iodine contamination in the environment (particularly in milk) following Chernobyl as a reason for concern from Fukushima, however the levels of contamination from Chernobyl were far, far greater than those from Fukushima. Unlike Chernobyl, comparatively little radioactive material escaped the reactor, nor was this material lofted high into the air through fires like those found in Chernobyl. As a result, the levels of contamination are far smaller and the effects far more localized. Evidence of this is found in the relative dose estimates based upon monitoring stations around Japan and the plant itself; doses at the plant boundary have been around a few millirem per hour and dropping (particularly as coolant has been restored to spent fuel pools); levels are far lower than this farther away from the plant. 

Beyond reconstruction of the heavily damaged area (both from the earthquake and tsunami), one of the major challenges appears to be in overcoming the stigma of radiological contamination, despite the extremely low levels present (particularly after a few weeks). While any actual long-term health risk from radioactive contamination will be quite minimal after a few weeks (with no immediate-term risk at all), overcoming the stigma of radioactive contamination will take some time. In particular, one of the most pressing challenges will be to further educate the public about both comparative levels of radiation found in nature and the (relative lack of) increased risk from low levels of additional radioactivity.

Update: Alan asked about the nature of emissions from these isotopes of concern and what their subsequent "weighting" factors would be. Cs, Sr, and I are all beta emitters; Cs-137 decays into Ba-137, which has a short-half life and gives off a gamma as it decays. Given this, the weighting factors for each is "1" - so in other words, the conversion from gray/rad is the same value in sievert/rem.

I also found some more resources on maximum recommended contamination levels - the World Health Organization generally recommends contamination levels expressed in units of activity per unit mass - i.e., Becquerels per kilogram (Bq/kg). One Becquerel is one decay per second - so 1000 Bq is 1000 decays per second. (While this sounds large, keep in mind just how many atoms are in even one gram of material - 1000 Bq is actually pretty small.)

The WHO recommends the following limits in foods:

Radioisotope Max activity (Bq/kg)
I-129, I-131 1000
Cs-137 100
Sr-90 100

This of course is not a comprehensive list (the list is found on page 33 of the above-linked document), however it covers the radioisotopes of concern here.

(For those curious - one can calculate an equivalent dose received by multiplying the following formula: Exposure = Activity [Bq/kg] * Mass consumed [kg] * Age-dependent ngestion coefficient [mSv/Bq]. These ingestion factors are in the above-linked document; I will cover this topic in more detail in a further post.)

CNN is reporting measurements of 965 Bq/kg in tap water in a village in Fukushima prefecture (where the Fukushima Daiichi plants are), compared to a national regulatory limit of 300 Bq/kg. As a result, authorities are advising residents to avoid drinking tap water for the time being.

Again, however, knowing the half-life of I-131 allows us to know when these levels will fall to the safe (conservative) limits; in this case, in about two weeks for an areas closest to the contamination source. While certainly undesirable, in this time frame there are likely other problems with tap water as well beyond radiation, including contamination from biological pathogens, particularly given the tsunami.

Friday, March 18, 2011

This is what panic looks like

Right now, people are buying up packets of potassium iodine tablets in a panic, bidding the price up from $10 per pack to around $540. The worst part of all of this is that many of these people are in places far away from Japan, including places such as Russia, British Columbia, and California.

There is nothing more counterproductive in a situation like this than blind panic, particularly when it's carried out by those at no risk whatsoever. (I'm looking at you, California.) In particular, the real danger here in these kinds of panic buys is in depriving those who may actually need them the most.

The CDC has correctly emphasized that people in the United States should not be taking potassium iodine in response to the events at Fukushima. Of course, this kind of hysteria is not an unknown - one need only go back to the mass panic purchases of Cipro shortly after the highly publicized anthrax letters in 2001 to find a recent example.

Nuclear Fissionary points to a hoax fallout map which has been making its rounds around the internet, stoking these very fears. Note that the radiation levels at the nearest measuring point of Ibaraki prefecture (100 miles from Fukushima) are merely elevated (i.e., detectable above natural background) - as in, there is no serious danger (levels are around 0.01-0.02 millirad per hour - in other words, quite low.) At this point, it is unlikely that any significant changes from background levels can even be measured outside of Japan.

President Obama emphasized in his speech yesterday, "The Center for Disease Control does not recommend that people in the U.S. take any precautions other than being fully informed." This is the correct response. However, one issue which has muddled the overall measured tone of the administration's response has been the directive for U.S. citizens within 50 miles (80 km) of Fukushima to evacuate - for comparison, the official evacuation zone imposed by the Japanese has been 12 km, with residents within 20 km advised to stay indoors with their windows closed. Rod Adams at Atomic Insights has been sharply critical of this move, and I think some of the rationale bears repeating.

Right now, there is an intense humanitarian crisis going on, brought about by a record earthquake and devastating tsunami. For these people - estimates put the number displaced around 380,000, finding food, clean water, and shelter from the elements where the temperatures have reached below freezing is the highest priority. Any evacuation should be weighed against the risks of displacing yet more people in a disaster area, much less the exposures created by forcing them out of their homes (where reasonable measures can be taken to protect against elevated radiation exposure, such as sealing doors and windows).

While it is my personal opinion that an evacuation of those closest to the plant was likely reasonable balanced against the risks (despite the fact that the radiation levels pose no immediate threats to human health at the plant boundary), advocating for an increase in the evacuation zone to four times the level that the Japanese government has set out (all while in the middle of a record natural disaster) seems downright irresponsible. The response of the administration and the NRC is that this radius would be standard procedure in the United States for a similar situation; however, it is extremely questionable as to the additional benefit of evacuating such a large additional number of people, particularly weighed against the additional exposure and other risks that such a larger evacuation entails.

For those curious, ANS has a special interactive page where one can see what their annual dose is from a variety of natural and synthetic sources (particularly from common medical procedures). This can help put the radiation levels being discussed in context.

NISA has also posted an English version of the latest radiation readings outside of the 20 km zone around Fukushima. For reference, 1 microsievert = 0.1 millirem (or, conversely, 1 millirem = 10 microsievert). The document also helpfully notes that the current measured average in Tokyo right now is about 0.05 microsievert/hour = 438 microsievert/year, or about 44 millirem/year. (Average exposure from everyday sources for individuals typically ranges in 400-600 millirem/year).

Meanwhile, the best advice for situations such as this was offered by Douglas Adams in "The Hitchhiker's Guide to the Galaxy": Don't Panic.

Thursday, March 17, 2011

Fukushima update

The latest release from TEPCO:
Unit 3 (Shut down)
  • In order to cool spent fuel pool of Unit 3 we conducted water spray by helicopters of Self-Defense Force at approximately 9:48 am. We are continuously monitoring the spent fuel pool and plan to conduct water spray to other Units.

This appears to be the only "updated" information from TEPCO at the moment - the rest of the press release was identical to prior releases. This is consistent with reported information from yesterday. No reports from TEPCO concerning the spent fuel pool at Unit 4.

From NISA, the Japanese NRC (Note: Trimming to provide only the most recent updates - full report is at the link):
  • The electrical cables for receiving electricity from the transmission line of Tohoku Electric Power Co. are planned to be installed (07:30 March 17th)
  • The procedures for spraying water into the spent fuel pool of Unit 3 are being checked. (07:00 March 17th)
  • <Unit 1>
    • Seawater is being injected as of 04:00 March 17th.
    <Unit 2>
    • Seawater is being injected as of 04:00 March 17th.
  • <Unit 3>
    • Seawater was discharged 4 times to Unit 3 by the helicopters of Self-Defence Force. (9:48, 9:52, 9:58 and 10:01 March 17th)
    • The riot police arrived at the site for grand discharge. (16:10 March 17th)
    • Seawater is being injected to RPV as of 17:30 March 17th
  • <Unit 4>
    • The fire occurred at Unit 4. (5:45 March 15th) TEPCO reported that no fire could be confirmed on the ground.(06:15 March 16th)
    • The water injection is suspended as of 17:30 March 17th
  • <Units 5 and 6>
    • Emergency Diesel Generator (1 unit) for Unit 6 is operable and supplying electricity to Units 5 and 6. Water injection to the Spent Fuel Pool through MUWC is progressing. It is scheduled to inject water to RPV after the recovery of external power source.
In a welcome development, NEI and NISA also report that technicians are laying electrical lines to connect Unit 2 to offsite power, meaning that cooling pumps could be turned back on, preventing any further fuel damage from overheating and allowing workers to focus on other units.

JAIF reports three operations were attempted to deliver water to the spent fuel pools at Unit 3. One operation involved four "bucket drops" from a helicopter with a lead-lined bottom (and workers in radiation suits). In a second attempt, the National Police agency attempted to spray water from the ground, however the spent fuel pool is at the top of the reactor building, and they were unable to get close enough to do so due to elevated radiation levels. In a third attempt, special pump trucks have been brought in with water cannons (which do not require personnel to leave the truck) and have been reported to have delivered 30 tons of water to the building. Whether this has been effective will be evaluated.

It is unclear at this point what the status of the water levels in the spent fuel cooling pools at Units 3 and 4 are; the latest from JAIF indicates water levels are a current concern for Units 3 and 4.. However, all current reports appear to indicate the focus has been on Unit 3, rather than Unit 4. World Nuclear News reports that Japanese officials have made assurances that some water has been still observed in spent fuel pools during helicopter drops at Unit 4.

NEI also reports that the site boundary readings at the Fukushima Daiichi plant were reading around 2 to 3 millirems per hour. This level is still elevated, but relatively low. Radiation exposure rates at the plant themselves are higher; World Nuclear News has reported them to be around a peak of 400 millisieverts per hour at Unit 3 (inland) and 100 millisieverts per hour at Unit 4 (inland) - this corresponds to a dose rate of around 40 and 10 rem per hour. These are high exposure rates (where acute effects begin to become a concern after prolonged exposures), severely limiting workers' access to peak exposure areas.

Readings from monitoring sites using the SPEEDI tool Alan linked to indicate radiation levels at Ibaraki prefecture (the closest currently operational monitoring site) show levels on the range of 100-200 nGy/hr (about 0.01-0.02 millirad/hr) and are steadily dropping, with no recent peaks appearing in the last 24 hours. These levels are very low and appear to be a good sign.

Wednesday, March 16, 2011

Spent fuel pools at Unit 4

Water levels a concern for Unit 4 spent fuel pools

One of the big issues for those following the news right now has been the status of the spent fuel cooling ponds at Fukushima Daiichi Unit 4. Unit 4 was undergoing regular maintenance prior to the earthquake; no fuel was in the reactor. Thus, until now it has not been as serious of a concern as Units 1, 2, and 3.

Reports from the Japan Industrial Atomic Forum (JAIF) indicate low water levels at the spent fuel pool, with damage suspected to the fuel rods. An explosion and fire have also been reported at Unit 4. While some suspect the explosion may have been hydrogen-related, the spent fuel pool was significantly cooler than the reactors at Units 1 and 3, with temperatures reported to be around 85 C (185 F) over the past two days - thus, the explosion remains difficult to understand. Several fires have also broken out over the last two days in the spent fuel storage area - sources indicate that these have been machinery oil fires, which have since been contained. Reports of low water levels at the Unit 4 spent fuel storage pool appear to have begun at least 24 hours ago (as of 19:00 hours on March 15).

It is difficult to determine the current status of the fuel pool, given conflicting accounts. U.S. NRC chairman Gregory Jazcko has indicated that it is his staff's belief that, "there is no water in the spent fuel pool." This was immediately contradicted by a TEPCO spokesperson who indicated "the condition is stable", however no further updates are available at the TEPCO website. However, water levels at the spent fuel pools have been a reported concern for some time, according to both World Nuclear News and NEI.

The Nuclear Industrial Safety Association - Japan's version of the NRC (and part of the Ministry of Economy, Trade, and Industry - METI) - has most recently reported the following:
<Unit 4>
  • It was confirmed that a part of wall in the operation area of Unit 4 was damaged. (06:14 March 15th) 
  • The fire at Unit 4 occurred. (09:38 March 15th) TEPCO reported that the fire was extinguished spontaneously (11:00 March 15th) 
  • The temperature of water in the Spent Fuel Storage Pool at Unit 4 had increased. (84 ℃ at 04:08 March 14th)
  • The fire occurred at Unit 4. (5:45 March 15th) TEPCO reported that no fire could be confirmed on the ground.(06:15 March 16th)
  • The water injection was stopped. (14:00 March 16th)

CNN and NHK are currently reporting that JSDF helicopters are currently attempting to drop water onto the Unit 4 building in order to add coolant, as well as water cannons (essentially, fire engines) on standby.

Spent fuel pool basics

Unlike the fuel immediately after shutdown like in Units 1 and 3, spent fuel sitting in the cooling pool is considerably cooler, although it still generates enough heat to require water cooling. Spent fuel is generally about 10-13 feet in height; the water covering this fuel is generally at least another 20 feet in height above the fuel itself. This water serves a dual purpose - it both keeps the fuel cool and provides a good measure of radiological shielding; exposure rates immediately above the spent fuel pool are such that workers can generally be in the area without special protective equipment - generally less than 2 millirem per hour (about a fifth of the dose of a chest x-ray).

A spent fuel storage pool (Image courtesy of IEEE spectrum)

The spent fuel storage pool is kept at atmospheric pressure, unlike the reactor. Under normal conditions, pumps will circulate cooling water in order to keep the rods cool, although under emergency conditions, natural circulation is expected to take over (i.e., where warmer water expands and grows less dense, thus rising to the top, while cool water, which is denser, sinks - thus providing a natural "circulation" for heat removal around the rod.) These spent fuel pools tend to be quite robust - a simple failure of pumps or piping would not be able to drain the water level from these pools, which are made of thick concrete and steel.
Generally, the only way significant water level changes could be expected in the spent fuel pool are from evaporation of the water or if a large crack were to develop in the pool itself. Readings over the last two days indicate that the temperatures of the pools were elevated, at around 85 C (185 F) - while certainly warm, well below boiling. (However, one can expect an increased rate of evaporation at this temperature). The IAEA confirms these temperatures for the prior two days, however no data was available for today. If accounts of diminished water levels are to be believed, this would imply that there may be structural damage to the building; this much is unknown at this time.

Reports indicate that there may be fuel damage due to dropping water levels - this would likely be in the form of cladding failures, which have released radioactive fission gases similar to the process in Units 1, 2, and 3. The major concern for workers right now is in personal safety - without the protective layer of water, there is significantly less radiological shielding, making it far more difficult to operate around the spent fuel pool. This would appear to be the reason for using water cannons and helicopter drops in order to supply emergency water, in order to bring radiation levels back down (by providing an adequate layer of water for shielding). 

For those keeping score at home, the radiological source from these spent fuel rods would be deep-penetrating gamma radiation; the danger to workers is that the exposed would be that in the absence of the several feet of water shielding, the spent fuel rods would essentially act as a "gamma flashlight" pointing out of the fuel pool.

Depending upon the age of the fuel rods themselves (which determines the level of decay heat), it seems less likely that any kind of actual fuel melting would occur itself. Rather, the chief issue appears to be in the radiological release from ruptured fuel cladding as well as the higher levels of radioactivity, which make it extremely difficult for workers to get close to the pool in order to refill it with coolant - hence the use of helicopters and water cannons from the ground. 

I will continue to update as I learn more - unfortunately, the news on this appears to be very scarce, and mixed at best.

Update: JAIF confirms helicopters dropping seawater on Units 3 and 4 due to low coolant levels. Private sources have also begun to confirm that water levels are very low at Unit 4.